LOWER
ALTAMAHA WATERSHED
 The entire Altamaha Basin is the largest watershed in the State of Georgia
draining about 1/4 of the state area. It is also the third largest basin
draining to the Atlantic Ocean. It is formed by the confluence of Ocmulgee,
Oconee and Ohoopee
rivers. From the confluence point of Ocmulgee and Oconee rivers down to the
Atlantic Ocean, the river system is known as the Altamaha
river. It is only this most downstream part of this large basin, which is
referred as the Lower Altamaha watershed. This study focuses on this section of
the entire Altamaha basin. During
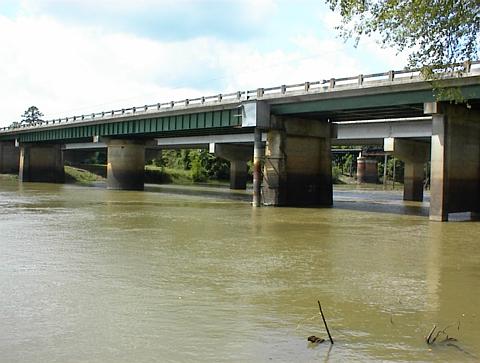
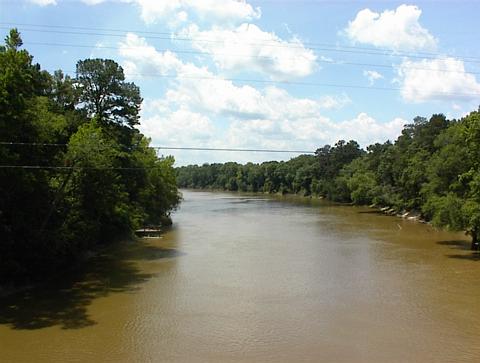
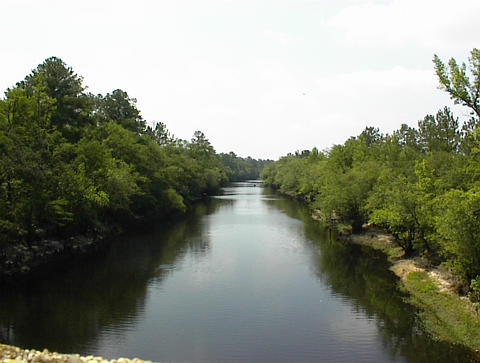
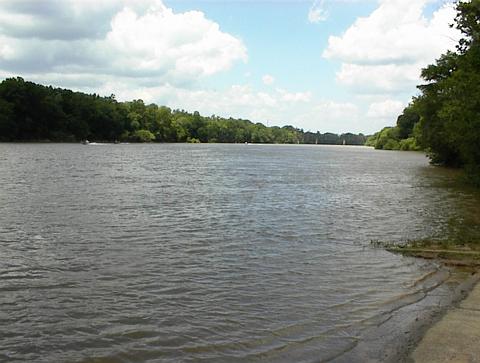
02-03 June 2001, a field trip is conducted to obtain a better understanding of
the Lower Altamaha watershed. The highlights of this trip are presented in our Field Trip
page. Please check it out for visual aids on the Lower Altamaha
watershed.
The entire Altamaha Basin is the largest watershed in the State of Georgia
draining about 1/4 of the state area. It is also the third largest basin
draining to the Atlantic Ocean. It is formed by the confluence of Ocmulgee,
Oconee and Ohoopee
rivers. From the confluence point of Ocmulgee and Oconee rivers down to the
Atlantic Ocean, the river system is known as the Altamaha
river. It is only this most downstream part of this large basin, which is
referred as the Lower Altamaha watershed. This study focuses on this section of
the entire Altamaha basin. During
02-03 June 2001, a field trip is conducted to obtain a better understanding of
the Lower Altamaha watershed. The highlights of this trip are presented in our Field Trip
page. Please check it out for visual aids on the Lower Altamaha
watershed.
 Administratively, the Lower Altamaha watershed is divided by 10 counties: Jeff
Davis, Montgomery, Toombs, Appling, Tattnall, Evans, Long, Wayne, McIntosh and
Glynn. A comparative table of the Lower Altamaha watershed, the 10 counties this
watershed resides and the state of Georgia is given in Table 1. It is
seen from Table 1 that even though the watershed covers about 2.5% of the
state's total area, only 0.7% of the state's total population reside in the
watershed, which gives a low population density.
Administratively, the Lower Altamaha watershed is divided by 10 counties: Jeff
Davis, Montgomery, Toombs, Appling, Tattnall, Evans, Long, Wayne, McIntosh and
Glynn. A comparative table of the Lower Altamaha watershed, the 10 counties this
watershed resides and the state of Georgia is given in Table 1. It is
seen from Table 1 that even though the watershed covers about 2.5% of the
state's total area, only 0.7% of the state's total population reside in the
watershed, which gives a low population density.
Table 1. Surface Area and Population
Characteristics of Lower Altamaha
| |
Surface Area (sq. mi.) |
Percent in Total (%) |
1990 Population |
Percent in Total (%) |
|
Lower Altamaha |
1,500 |
2.5 |
47,740 |
0.7 |
|
10 Counties |
4,345 |
7.4 |
185,144 |
2.9 |
|
Georgia |
59,000 |
100 |
6,478,149 |
- |
The lower Altamaha has an drainage
area of about 1,500 square miles compared to the total of 13,600 square miles of
the entire Altamaha. Looking at the overall hypsographic features of the entire
Altamaha basin, one can see that, with an average width of 16 miles, the
Lower Altamaha basin is like an 'outflow pipe' or a 'conduit' discharging
the combined flows of Ocmulgee and Oconee. The basin has an average elevation of
165 ft and an average annual precipitation of approximately 45 inch. At the USGS
Gaging Station near Doctortown, GA, the long term mean annual flow is
measured to be around 14,000 cfs.
 The lower Altamaha watershed shows
all characteristics of a typical lowland with gentle slopes. The maximum
elevation difference between the lowest and highest points of the watershed is
approximately 300 ft representing a very mild topography. The main feature of
the drainage pattern shows a meandering pattern in this low land area. Wetlands
are commonly observed in this low gradient areas, especially along the river
banks and in the coastal region. A contour map showing the Lower Altamaha
watershed illustrates three distinct topographic zones: (i) the (relatively)
highlands; (ii) the transition zone, and (iii) the lowlands or the coastal
plains. This map also shows the gradual increase in floodplain width as river
flows towards the lowland zone.
The lower Altamaha watershed shows
all characteristics of a typical lowland with gentle slopes. The maximum
elevation difference between the lowest and highest points of the watershed is
approximately 300 ft representing a very mild topography. The main feature of
the drainage pattern shows a meandering pattern in this low land area. Wetlands
are commonly observed in this low gradient areas, especially along the river
banks and in the coastal region. A contour map showing the Lower Altamaha
watershed illustrates three distinct topographic zones: (i) the (relatively)
highlands; (ii) the transition zone, and (iii) the lowlands or the coastal
plains. This map also shows the gradual increase in floodplain width as river
flows towards the lowland zone.
 The Lower Altamaha River is the main drainage feature in the basin. It has an
average slope of 0.00018 ft/ft and a gently meandering nature. This meandering
pattern of the Altamaha River can be seen from the figure to your left. The
drainage pattern given in this figure is created from an EPA
Reach File Version 3 (RF3). Especially in the coastal plains, the drainage
pattern becomes extremely complex to analyze. The Lower Altamaha River does not
have a significant drainage area but rather acts like a 'conduit' to convey the
combined flows of Ocmulgee, Oconee and Ohoopee. The average watershed width of
16 mi supports this finding.
The Lower Altamaha River is the main drainage feature in the basin. It has an
average slope of 0.00018 ft/ft and a gently meandering nature. This meandering
pattern of the Altamaha River can be seen from the figure to your left. The
drainage pattern given in this figure is created from an EPA
Reach File Version 3 (RF3). Especially in the coastal plains, the drainage
pattern becomes extremely complex to analyze. The Lower Altamaha River does not
have a significant drainage area but rather acts like a 'conduit' to convey the
combined flows of Ocmulgee, Oconee and Ohoopee. The average watershed width of
16 mi supports this finding.
 The soil data for the watershed is directly used in the infiltration computations
that are used to compute the excess rainfall. The Lower Altamaha watershed is
characterized by (i) loam; (ii) sand, and (iii) loamy sand type soils. The loamy
sand soils are mostly seen in the highlands, where as the sand soils are
commonly observed in the transition zone. It is also possible to see that the
organic matter and loam type soils are the most common soil type along the
Altamaha River floodplain. The soil map given to your right is created from the US
Department of Agriculture Natural Resources
Conservation Service's State Soils Geographic Database (STATSGO).
The soil data for the watershed is directly used in the infiltration computations
that are used to compute the excess rainfall. The Lower Altamaha watershed is
characterized by (i) loam; (ii) sand, and (iii) loamy sand type soils. The loamy
sand soils are mostly seen in the highlands, where as the sand soils are
commonly observed in the transition zone. It is also possible to see that the
organic matter and loam type soils are the most common soil type along the
Altamaha River floodplain. The soil map given to your right is created from the US
Department of Agriculture Natural Resources
Conservation Service's State Soils Geographic Database (STATSGO).
 The land cover/use of the Lower Altamaha watershed is another important source
of information for hydrologic models. The overland flow resistance is a direct
function of the type and density of the vegetation present on the land and the
type of land use practices applied. Focusing on the land cover/use map given to
your left, it can be seen that woody wetlands dominate the floodplain area
of the Altamaha River (see some of the pictures taken during the field
trip). Typical forest cover of the watershed is another common land cover
seen in the field trip pictures.
The land cover/use of the Lower Altamaha watershed is another important source
of information for hydrologic models. The overland flow resistance is a direct
function of the type and density of the vegetation present on the land and the
type of land use practices applied. Focusing on the land cover/use map given to
your left, it can be seen that woody wetlands dominate the floodplain area
of the Altamaha River (see some of the pictures taken during the field
trip). Typical forest cover of the watershed is another common land cover
seen in the field trip pictures.
Back
to Altamaha Homepage
Back to MESL Homepage
 The entire Altamaha Basin is the largest watershed in the State of Georgia
draining about 1/4 of the state area. It is also the third largest basin
draining to the Atlantic Ocean. It is formed by the confluence of Ocmulgee,
Oconee and Ohoopee
rivers. From the confluence point of Ocmulgee and Oconee rivers down to the
Atlantic Ocean, the river system is known as the Altamaha
river. It is only this most downstream part of this large basin, which is
referred as the Lower Altamaha watershed. This study focuses on this section of
the entire Altamaha basin. During
02-03 June 2001, a field trip is conducted to obtain a better understanding of
the Lower Altamaha watershed. The highlights of this trip are presented in our Field Trip
page. Please check it out for visual aids on the Lower Altamaha
watershed.
The entire Altamaha Basin is the largest watershed in the State of Georgia
draining about 1/4 of the state area. It is also the third largest basin
draining to the Atlantic Ocean. It is formed by the confluence of Ocmulgee,
Oconee and Ohoopee
rivers. From the confluence point of Ocmulgee and Oconee rivers down to the
Atlantic Ocean, the river system is known as the Altamaha
river. It is only this most downstream part of this large basin, which is
referred as the Lower Altamaha watershed. This study focuses on this section of
the entire Altamaha basin. During
02-03 June 2001, a field trip is conducted to obtain a better understanding of
the Lower Altamaha watershed. The highlights of this trip are presented in our Field Trip
page. Please check it out for visual aids on the Lower Altamaha
watershed.


