![]()


BACKGROUND
Massachusetts Military Reservation (MMR) Site History
Cape Cod
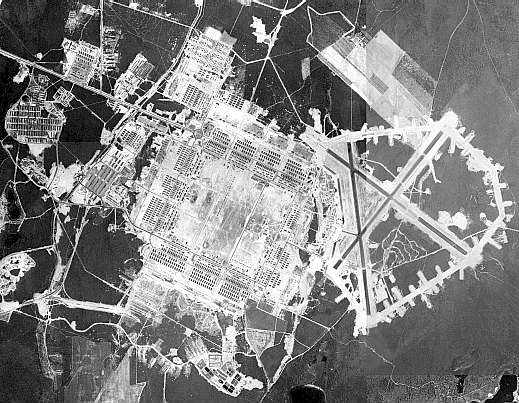
The MMR, which is located on western Cape Cod covers an area of about 34 mi2, which includes parts of the towns of Bourne, Sandwich, Mashpee, and Falmouth, Figure 2.1. The MMR has been in existence since 1912 and was a major installation for the U.S. Air Force during 1948-73. From 1940 to 1946, during World War II, intensive army activities occurred at the site. Air defense and surveillance operations at the Otis Air National Guard (ANG) Base/Camp Edward lasted from 1955 to 1970. Both army exercise and air
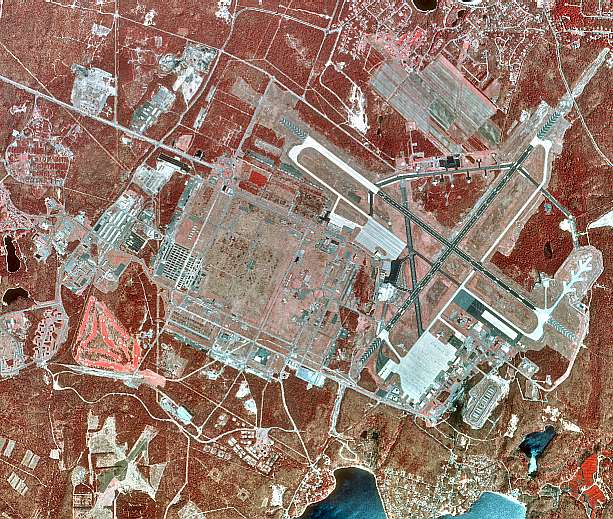
Otis AFB aerial photo, 1943
surveillance operations continue today at MMR. Since 1973, the MMR has been used primarily by the Massachusetts National Guard and the U.S. Coast Guard. Current users at MMR include ANG 102nd Fighter Wing, The Massachusetts Army National Guard, the U.S. Air Force's 6th Space Warning Squadron PAVE PAWS radar site, the 1st Battalion 25th Marines, and the U.S. Coast Guard.
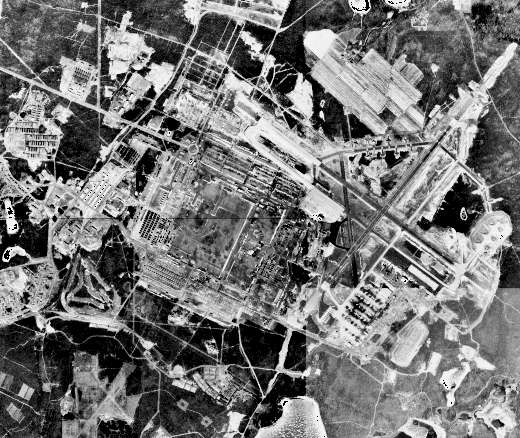
Otis AFB aerial photo, 1966
Past releases of hazardous materials such as solvents and petroleum materials have resulted in extensive groundwater contamination in the MMR aquifer. Established sources of contamination include former motor vehicle pools, live-firing areas, disposal sites (e.g.: landfills) and drainage structures (e.g.: dry wells). It is believed that most of these releases occurred during the years from 1940 to 1970. During the past decade, there have been several reports on MMR site characterization studies. In this section we provide a review of the site history, primarily based on the reports prepared by Masterson et al. [1996]; ABB Env. Serv. Inc. [1992, 1996] and Jacobs Eng. Inc. [1997]. A comprehensive database, historical information, community and remediation activities at MMR site can also be found on the WWW site http://www.mmr.org.
Otis AFB aerial photo, 1991
In 1986, the National Guard Bureau’s Installation Restoration Program (IRP) started a program to investigate contaminant plumes related to suspected toxic and hazardous materials at the MMR. Since the inception of the National Guard Bureau’s IRP, nine contaminant plumes from suspected sources on the MMR have been identified [ABB Env. Serv., Inc., 1992]. It is reported that on-base groundwater contamination has resulted in contamination of private residential and public wells near the base [ABB Env. Serv. Inc., 1996]. The contamination has been characterized as organic solvents from chemical spills, fuel by-products from fuel spills and leaking pipelines, and various organic and inorganic chemical constituents from both the landfill and sewage treatment facility at the MMR. In June 1994, the National Guard Bureau’s IRP received approval from the Department of Defense to implement a large-scale containment scheme designed to halt the migration of each of the nine contaminant plumes.
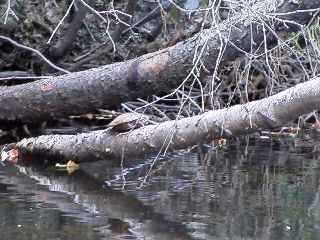
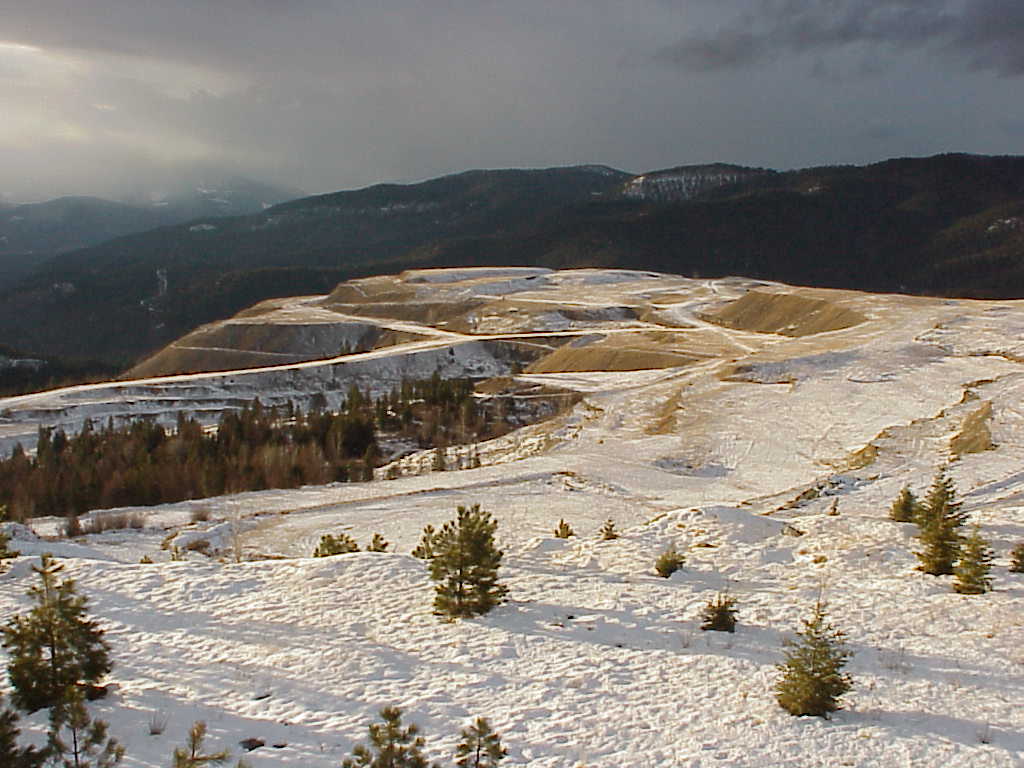
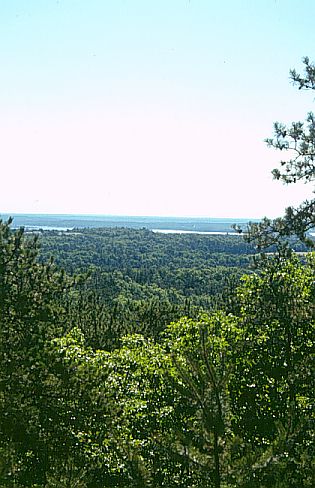
MMR, Habitat
The U.S. Geological Survey (USGS) has also studied the groundwater flow system near the MMR to characterize a contaminant plume and evaluate local and regional water-supply issues. LeBlanc [1984] provided the first detailed evaluation of the transport of the contaminant plume downgradient of the sewage treatment facility at the MMR. Guswa and LeBlanc [1985] provided an analysis of groundwater flow at Cape Cod. Barlow and Hess [1993] provided a detailed analysis of the ground-water/surface-water interactions and the effects of pumping on streamflow south of the MMR. Masterson and Barlow [1994] updated the investigation of Guswa and LeBlanc [1985] by evaluating the regional effects of changing pumping and recharge conditions on the groundwater flow system at Cape Cod. Although numerous investigations have been conducted by the National Guard Bureau’s IRP and the USGS near the MMR, the results of these investigations have not been directly applicable to the issue of regional groundwater contamination near the MMR. The issues that still remain unanswered include: (i) the path of plumes from contaminant sources on the MMR; (ii) the critical hydraulic properties that affect groundwater flow and contaminant migration; and, (iii) the effect of water-supply development and groundwater remediation schemes on groundwater flow and contaminant migration.
In 1992, the USGS, in cooperation with the National Guard Bureau, began a study to synthesize the existing hydrogeologic data to help develop an understanding of the hydrogeologic controls on the regional groundwater flow and contaminant transport near the MMR. As part of that study, a steady state, three-dimensional ground-water-flow model was developed on the basis of a detailed characterization of regional hydrogeologic trends in the glacial sediments of western Cape Cod. The initial framework of the new model was based on the existing West Cape model [Masterson and Barlow, 1994]. The new model was calibrated to historical contaminant migration data, water-level measurements, and stream flow.
A more recent report [Masterson, et al, 1996], presented the results of an analysis of the effects of simulated hydrogeologic conditions on groundwater flow and contaminant migration from suspected source areas on the MMR. Contaminant flow paths were calculated by particle tracking analysis. Based on this approach, an evaluation of the effects of simulated changes in hydrologic boundaries, such as ponds and streams, and hydrologic stresses, such as pumping and recharge, on groundwater flow pathways were made. This approach was later used for other source areas to evaluate contaminant migration pathways at the site. Since only particle tracking analysis was used in these studies, it cannot provide convincing conclusions for the evaluation of contaminant migration pathways at the MMR site. Particle tracking analysis, which is based on the advective component of the transport process, does not account for the dispersive and geochemical transport component. Advective transport component is only one of the several important transport processes, which may influence migration of contaminants in the subsurface.
Chronology of Events at the MMR
Site As can be seen from the site history described above, activities at the MMR site are complex and contamination chronology at the site is based on multiple activities at numerous potential source locations. For example, for the EDB plume there are at least 14 possible source locations at MMR, which were operated during the period 1940-1973. While conducting the present study, we did not have access to a complete record of activities, which would identify contamination event time line and source concentrations at these contamination events. Based on the references reviewed, one may conclude that these historical records may not be available at all. Due to short duration of this study, no attempt was made to search for these records. However, primarily based on the references collected for this study, which are given in the references section of this report, the following chronology on site activities and remediation studies can be given.
MMR Site Chronology:
1930's Base established. Most of the industrialized activities associated with military use occurred in the southern portions of the reservation. Aircraft runways, aircraft and vehicle maintenance areas, landfills and firefighter training areas were often used.
1940-46 U.S. Army builds/operates Camp Edwards. Heaviest military activity by the U.S. Army was conducted during this period. The use of petroleum products and other hazardous materials were high. Common practice for many years was to dispose of such wastes in landfills, drywells, dumping them and burning them at firefighter training areas.
1940-46 Area of contamination CS-4 was operated as a military vehicle maintenance area by the U.S. Army.
1955-72 Base used by U.S. Air Force - Otis AFB. Similar disposal operations described for the period 1940-46 continues.
1955-73 Area of contamination CS-4 was operated as a military vehicle maintenance area by the U.S. Air Force.
1978-79 Contamination found in Falmouth well; Ashumet Valley plume mapped by USGS.
1982 Installation Restoration Program (IRP) established.
1985 Contamination found in private wells to the south of MMR.
1986 Technical Environmental Affairs Committee (TEAC) formed.
1986-present CS-4 contamination area is under study.
1989 MMR added to USEPA's National Priorities List (NPL).
1992 Groundwater extraction and treatment system installed for CS-4 plume Operable Unit 2.
1992 EDB is detected in one of the monitoring wells (MW-1206Z) put in place for CS-4 plume. EDB plume characterization begins. No historical link between the CS-4 solvent plume and the EDB plume is made.
1993 Chemical Spill (CS-4) groundwater extraction and treatment system began operation.
1994 Soil cleanup begins at several source areas, plume response plan is issued.
1995 March: Design is initiated.
1995 September: DOD/USEPA/MADEP agree on plan.
1995 Main base landfill capped.
1995 Design for groundwater plume containment begins.
1995 Treatment system installed at Fuel Spill 12 (FS-12)source area in Sandwich.
1996 January: 60% design released.
1996 February: Public comment on 60% design; full containment deemed environmentally unacceptable.
1996 May: Air Force Center for Environmental Excellence (AFCEE) assumes responsibility for program.
1996 July: Strategic Plan issued with Comprehensive Plume Response Plan and Schedule.
1996 September: EDB RI/FS Data Gap Sampling efforts begin.
Potential Contaminant Sources
Groundwater beneath the MMR has been contaminated as a consequence of various military-related practices that date back to the early 1900's [Masterson et al., 1996]. The sources of these contaminants include the MMR landfill, a sewage-treatment facility, and several chemical and fuel spills, Figure 2.2. The contaminants of primary concern are chlorinated organic solvents and fuel by-products, such as 1,2-dichloroethylene (DCE), tetrachloroethylene (PCE), trichloroethylene (TCE), and ethylene dibromide (EDB), which have been detected in the groundwater at the MMR at concentrations as high as 1,200, 982, 3,200, and 1,550 µg/L, respectively [Masterson et al., 1996]. In the literature referenced above, nine known contaminant plumes at the MMR site were cited. In the discussion below, based on their potential contribution to EDB plume to the south of MMR, some of these sources are described. Information on the dimensions and chemical constituents of the plumes were obtained from reports written by Masterson et al. [1996] and ABB Env. Serv. Inc. [1995]. The first reference above cites that their information was obtained from the National Guard Bureau Installation Restoration Program (written communication, 1994).
MMR Landfill Plume (LF-1): This source area, Figure 2.2, served as the main sanitary landfill at MMR since 1948. The landfill is about 10,000 ft from the western and southern MMR boundaries and occupies 100 acres. A plume of dissolved chlorinated volatile organic compounds, primarily PCE and DCE, has developed downgradient from the landfill [ABB Env. Serv., Inc., 1992]. The plume, which is migrating in a west-southwestward direction toward Squeteague and Red Brook Harbors is about 16,500 ft long, 6,000 ft wide and 90 ft thick. The leading edge of the plume is about 50 to 70 ft thick, ranges in altitude from 20 to 90 ft below sea level, and extends about 3,100 ft beyond the MMR base boundary.
Sandwich Contamination Site, Fuel Spill - 12 (FS-12): This source area, Figure 2.2, is about 3,000 ft north of Snake Pond. At this site, leakage from an underground fuel pipeline during 1965-72 resulted in a lense of free product floating on the water table and contaminated groundwater as far as 5,000 ft downgradient from the location of the contamination source area. The contaminant of greatest concern in this plume include benzene and ethylene dibromide (EDB) [Advanced Sciences Inc., 1993]. The general direction of plume movement is south-southeastward. The leading edge of the EDB plume is about 3,800 ft beyond the MMR site boundary and ranges in altitude from about 50 to 125 ft below sea level [Masterson et al., 1996].
Ashumet Valley Source Area (AVS): This plume has two source areas, the inactive Fire-Training Area No.1 (FTA-1) and the MMR sewage-treatment plant, Figure 2.2. The FTA-1 site occupies about 3 acres near the southern boundary of the MMR. The FTA-1 site was a fire-fighter training area during 1958-85. During this period, waste fuels, oils, and solvents were burned in unlined areas and extinguished by the fire department. As a result of these practices, some of the chemicals seeped into the ground and became a source of groundwater contamination.
The MMR sewage-treatment plant is about 1,000 ft downgradient from the FTA-1 site at the southern boundary of the MMR. The plant occupies about 80 acres and has been in operation since 1936. The plant was a primary sewage treatment facility during 1936-41, and has operated as a secondary wastewater treatment facility since 1941. The discharge of sewage effluent to sand infiltration beds and sewage sludge to sludge-drying beds has resulted in a plume of sewage contaminated groundwater [LeBlanc, 1984]. In addition to municipal sewage, waste battery electrolytes, cleaners, solvents, paint thinners, and sludge from fuel tanks are also believed to have been disposed of at the sewage treatment plant.
The contaminants of greatest concern include 1,2-dichloroethylene, PCE, and TCE. The plume is migrating in a southerly direction toward Nantucket Sound. The leading edge of the plume is about 16,000 ft beyond the MMR boundary and ranges in altitude from about 25 to 90 ft below sea level.
Chemical Spill - 10 (CS-10): This source area, Figure 2.2, occupies about 38 acres and is near the eastern boundary of the MMR. The primary sources of contamination at this site were chemical spills and the disposal of chemical waste in leaching wells and oil interceptors [ABB Env. Serv., Inc., 1993]. The contaminants of greatest concern in the ground water include PCE and TCE. The plume is migrating in a southerly direction towards Nantucket Sound. The plume is about 13,500 ft long, 3,800 ft wide, and 40 to 100 ft thick. The altitude of the plume ranges from about 10 to 80 ft below sea level. This source is identified as one of the significant sources for the EDB plume. During 1996, field investigations show that groundwater EDB concentrations at this source is around 0.05 µg/L [ABB Env. Serv., Inc., 1997].
Chemical Spill - 4 (CS-4): Information on this source area, Figure 2.2, was obtained from ABB Env. Serv. final report on “Monitoring Well MW-1206Z Groundwater EDB Investigation,” [ABB Env. Serv. Inc., 1995] and also from web page documentation on the MMR site. According to these sources, CS-4 area had been used by the U.S. Army in World War II operations (1940 to 1946) and by USAF (1955 to 1973) as a military vehicle maintenance area. The CS-4 area is located approximately 6,000 ft to the northeast of Osborne Pond and 10,500 ft to the southwest of Snake pond, Figure 2.2. CS-4 was reportedly inactive between 1946 and 1955. Wastes potentially spilled or dumped there included: oils, solvents, antifreeze, battery electrolytes, paint, and waste fuels. The area also served as a waste storage yard from 1956 until 1983. A storage yard consisting of six 5,000-gallon underground storage tanks (USTs), used previously for gasoline storage, was maintained by the MMR Defense Property Disposal Office (DPDO) in the northern portion of CS-4 source site between 1965 and 1983. During this period, wastes, including transformers, electrical equipment, waste oils, solvents and waste fuels generated at on-base laboratories and ships were transported to CS-4 area before off-base disposal. These activities led to contamination of soil and groundwater at the CS-4 site over an intermittent period from 1940-1983. In September 1984, the last USTs were emptied and removed. All activities on the CS-4 source site were terminated in 1986.
Groundwater contamination was inevitable as chemicals leached from the contaminated soil into the groundwater. A cigar-shaped plume stretching some 11,000 feet downgradient and southward from the source site was discovered during site investigations, Figure 2.3. Spanning some 800 feet in width, 40 feet in thickness and 11,000 feet in length, the CS-4 plume traced a somewhat horizontal path approximately 120 feet beneath the ground surface (or approximately 60 to 100 feet below the water table, approximately 15 to 55 feet below mean sea level (MSL)), towards the monitoring well MW-1206Z. During the characterization of CS-4 area, groundwater contaminated by chlorinated volatile organic compounds (VOCs), principally tetrachloroethene (PCE), trichloroethene (TCE), 1,1,2,2-tetrachloroethane, and 1,2-dichloroethene (1,2-DCE), was detected. Maximum total chlorinated ethene concentrations range up to approximately 86 µg/L. Remediation of this plume began in December 1992 and is continuing concurrent with other remediation activities at the site.
Analytical data collected in late 1992 and early 1993 suggested that a zone of groundwater beneath and/or downgradient of the CS-4 solvent plume was potentially contaminated with EDB. Although EDB was detected in only one well, the spatial distribution of the other existing CS-4 wells was such that the lack of detections of EDB in these other wells failed to conclusively indicate that the EDB detected in MW-1206Z, Figure 2.3, was an isolated occurrence. Specifically, because MW-1206Z was the deepest well in this area and is located within the furthest downgradient fence of the CS-4 monitoring wells, characteristics of both deeper and further downgradient portions of the aquifer were not adequately represented by existing wells.
In December 1992, CS-4 area groundwater monitoring wells located in the vicinity of the planned extraction wells were sampled to verify the current location of the leading edge of the solvent contamination before installing the extraction wells. During this sampling and analysis event, EDB was discovered in groundwater from one well (i.e., MW-1206Z) at concentration up to 0.06 µg/L, which is above federal drinking water standard Maximum Contaminant Level (MCL) of 0.05 µg/L and Massachusetts MCL of 0.02 µg/L [USEPA, 1992; MADEP, 1992]. Other groundwater from the sampled wells showed no detections of EDB. Because EDB had not previously been identified as a potential contaminant of concern, groundwater sampling at these wells during the plume delineation tasks had not included analysis for EDB at low detection limits (e.g., 0.02 µg/L).
In April 1991, selected wells were sampled and analyzed for VOCs by USEPA Method 524.2; although EDB was a target analyte, the method detection limit was 0.4 µg/L. Results from this sampling event (including MW-1206Z) do not show EDB at this detection limit. In December 1992 and January 1993, repeat sampling and analysis events using one laboratory (Barnstable County Health Department Laboratory, BCHDL) showed EDB to be present in MW-1206Z. An additional confirmatory sampling and analysis event in January 1993, using two different laboratories, generated values different from those measured by BCHDL. New England Testing (NET) reported EDB at a concentration of approximately 0.03 µg/L, or about twice the estimated concentration noted by BCHDL. Certified Engineering and Testing Co. did not detect EDB at a detection limit of 0.02 µg/L.
Fuel Spill - 28 (FS-28): Information on this source area, Figure 2.2, was obtained from ABB Env. Serv. draft report on “Fuel Spill (FS-28) Plume Technical Decision Memorandum,” [ABB Env. Serv. Inc., 1997] and also from Web page documentation on the MMR site. According to these references, it is stated that the actual source of the FS-28 plume has not been delineated. It appears likely that several areas may have released EDB in varying quantities at various times. According to ABB report, Chemical Spill 10 (CS-10) area was identified as the only significant source for the FS-28 plume. This area is located approximately 2400 ft to the north (upstream) of the CS-4 plume source discussed earlier. Again according to ABB report, the southern most source area for the FS-28 plume is identified as the Fuel Spill 2 (FS-2) area, which is located approximately 7,000 ft to the south of the CS-4 source area or approximately 1,500 ft to the north of the MMR site boundary north of Coonamessett pond. The FS-28 plume was discovered in December 1992 when groundwater was sampled to determine the downgradient extent of the Chemical Spill No. 4 (CS-4) plume. In this field investigation EDB was detected in monitoring well CS-4/MW-1206Z at concentrations in excess of the federal drinking water maximum concentration level (MCL) of 0.05 µg/L. In January of 1993, additional sampling in the vicinity of this monitoring well confirmed the presence of EDB. This EDB plume was later designated as the FS-28 plume. At the request of IRP, monitoring wells were installed in the vicinity of the Town of Falmouth’s Coonamessett Water Supply Well (CWSW). This well is located in the vicinity and to the south of Coonamessett pond. When EDB was detected in deep groundwater samples collected from these borings, the FS-28 spill plume area and the investigations associated with it, was expanded. During later stages of field monitoring, EDB was detected at higher than previously measured concentrations north of Hatchville Road. Hatchville road is approximately 600 ft to the south of the southern most boundary of Coonamessett pond. In these investigations EDB was also detected at the top of the water table and in surface water samples collected from a cranberry bog at the Coonamessett River. Further studies indicate that EDB contamination was appearing at increasingly shallower depths in the cultivated cranberry bogs of Hatchville Road.
At the request of AFCEE, USGS has performed particle tracking analysis to evaluate contaminant transport pathways at the site. This modeling work was aimed at evaluating the effect of Coonamessett pond on the migration pathways of the FS-28 plume. At the present, FS-28 plume characterization and other related activities are part of the ongoing efforts at the MMR.
Based on the current literature available on the MMR site, the source areas described above constitute six of the more important source/plume areas mapped at the MMR. This selection was based on source producing parameters, which include: site history, historical usage of motor fuel, gasoline, aviation gas, herbicides, pesticides, indirect use of EDB, aquifer characteristics and geomorphology of the site deposits. In this evaluation, a practical source upgrading rationale was used in upgrading from a limited, partial source category to a significant source category [ABB Env. Serv., Inc., 1997]. Confirmed spillage from motor fuel, JP-4, aviation gas, or gasoline, and the associated laboratory analysis of VOCs, SVOCs, petroleum, and EDB in soils and groundwater samples were considered as evidence that the site was a probable contributing source of EDB. Sites which either never had fuels associated with them or which were located over groundwater that could not flow to the vicinity of the F-28 plume were considered non-sources.
This analysis [ABB Env. Serv. Inc., 1997], led to the conclusion that CS-10 area is a significant contributor to the EDB plume and CS-4, CS-5, FS-2, FS-9, FS-19 areas are partial contributors to this plume. Others areas were considered to be limited partial or non-source areas.
EVALUATION OF MULTI-PATHWAY SCENARIOS
Using the concentration reduction and accumulation factors defined in MESL [1998], several scenarios may now be evaluated in an effort to estimate the concentration levels at the Coonamessett Pond area or the area between the Coonamessett Pond and the Round Pond. A typical calculation is given below for one of the scenarios for the CWSW region. For this case, CS-3 source area is considered as a potential source area in MMR. Similarly, other estimates may be calculated for other sources and other locations between the Coonamessett Pond and the Round Pond using the reduction and accumulation factors and contaminant arrival times given in MESL [1998]. In this study we have selected to present the results for three source areas. These are the CS-3, FS-2 and FS-9 source areas.
The reason for selecting these source areas as potential source areas, is based on the results of the numerical and analytical modeling study given in MESL [1998]. The analytical and numerical results given in MESL [1998], indicate the following: (i) the potential EDB plumes originating from potential source areas FS-18, CS-5, FS-19, CS-3 (USCG) are migrating in a southwestern direction so they may not have contributed to EDB contamination observed to the south of Coonamessett Pond; (ii) remaining potential source areas such as CS-10, CS-4, FS-9, CS-3 and FS-2 could be considered as potential contributors to Coonamessett Pond EDB plume; (iii) the travel time analysis conducted for the CS-10 source area in MESL, 1999, indicates that the EDB plume originating from this source area may not have reached the area to the South of Coonamessett Pond within sixty years. The effects of this plume would have been observed after 1998 if there was no remediation effort at the site; (iv) this elimination approach would leave FS-2, CS-3, FS-9 and CS-4 as potential contributors to the EDB plume at the Coonamessett Pond area; and (v) FS-9 and CS-4 areas are close to each other and in this study FS-9 has been selected to be the representative source among these two potential source areas. Thus, the potential source areas that we will consider in this section are FS-2, CS-3 and FS-9 source areas.
The other important observation that can be made from the results of numerical simulations that are given in Section 4 are: (i) Coonamessett Pond and also Deep Pond act as a hydraulic barrier and also as a sink to EDB plumes that may be originating from potential source areas such as CS-4, FS-9 and FS-2. Thus, groundwater pathway, followed by pond pathway, followed by river pathway is a more likely scenario for these sources; (ii) Numerical results obtained indicate that this may not be the case for the CS-3 source. Primarily due to hydrogeologic conditions and the location of the CS-3 source area relative to Coonamessett Pond, the migration pathway of the EDB plume originating from CS-3 source area is in a southeastern direction. Thus, this plume may reach the cranberry bogs area, to the east of Coonamessett Pond, without significant interference from the Coonamessett Pond. In this case, the groundwater pathway should be considered to be the primary pathway for this plume.
The distance between the CS-3 source location and the CWSW area or the region to the east of the pond, at about the same latitude, is approximately 13,200 ft. Historical records indicate that, the contamination at the CS-3 source location may date back to 1930s. Based on the discussions given in MESL, 1999, a source concentration of 2500 µg/L and 4,000 µg/L will be used as a typical aquatic dissolved phase source concentration at the soil surface. These two concentration values are significantly lower than the solubility of EDB in water, which is approximately 4250 mg/L. Thus, the probability of having higher EDB source concentrations at the MMR site is high. This historical data, which may exist in the archives of MRR documents, was not available to us at the time this study was conducted. The source concentration range given above, was selected as an estimate of dissolved phase EDB source concentrations at MMR based on a reference which cites measured EDB concentrations at the MMR in the range of 1,550 µg/L [Masterson, 1996] and consistent observations of EDB groundwater concentrations made at the CWSW area in the range 0.02 µg/L to 3.0 µg/L, which were used to calibrate the analytical models. Based on these two initial source concentration values and the contamination starting time, the following estimates may now be made. This scenario may represent a typical scenario for the CWSW area contamination or east area of Coonamessett Pond from source CS-3. The calculations given below are shown for a source concentration of 2,500 µg/L. These calculations may be repeated for a source concentration of 4,000 µg/L. Results of these calculations are given in Table 5.1.
CONCLUSIONS
The estimation of the environmental concentration and the arrival time of the contaminant at a point of exposure, is an important source of information which is necessary for satisfactory completion of exposure assessment studies. These estimates are usually obtained from field data analysis and mathematical modeling. In the absence of field sampling data, this process may rely primarily on the results of mathematical models. In the case of MMR, significant effort has been placed on field and modeling studies, which characterize several contaminant plumes originating from the MMR site. Although the primary source of the EDB plume within the MMR site, which is contaminating the Coonamessett Pond area has not yet been identified, these field studies indicate that the EDB plume has reached the Coonamessett Pond area at concentration levels higher than MCL (EDB Massachusetts MCL 0.02 µg/L and EDB Federal MCL 0.05 µg/L) and the EDB plume may not have been produced by a single source at the MMR site. Based on the field studies conducted at the site, earlier investigators conclude that, a combination of multiple up-gradient sources, in varying degrees of source producing intensity, are responsible for inducing a cumulative EDB plume originating from the site [Jacobs Eng. Group, 1997; Appendix A]. According to these studies the following conclusions were drawn, which constitute the starting point of this study:
- FTA-1, CS-1, CS-11 and FS-27 areas are identified as non-source areas for the EDB plume.
- Chemicals used on cranberry bogs, farms and golf courses are not potential sources for the EDB plume. The major pesticides, insecticides, weed control and fertilizers for cranberry bogs and farms include: aldrin, carbamate, melathion, paradichlorobenzene, 2,4-D’, 2,4, 5-T, nitrogen, phosphorous and potassium.
- CS-3, CS-9, FS-7, FS-13 and FS-18 areas are identified as limited partial sources for the EDB plume.
- CS-4, CS-5, FS-2, FS-9, FS-19, UTES, DPDO, the Motor Pool and 3400 block areas are identified as partial source areas for the EDB plume.
- CS-10 area is identified as a significant source area for the EDB plume.
The purpose of this study is to complement the field and modeling studies conducted at the MMR over the past decade, in an effort to estimate the early arrival times and arrival concentration levels in the vicinity of the CWSW region. For this purpose, several mathematical and numerical models were used to evaluate multi-pathway (air, water, soil) migration of the EDB plume. The multi-pathway models used in this study are simple analytical and complex numerical models, which are available in the public domain literature. The limitations of these models and the assumptions made in implementing these models, are explained in detail in the references cited throughout the report. In this section, we will highlight important findings of the study. These findings are based on the literature reviewed and on the results of the analytical and numerical simulations conducted, a review of which is given in MESL, [1998].
The analysis presented in this study is based on a contamination starting date of early 1930s and a source contaminant concentration range of 2,500 to 4,000 µg/L. This range is significantly lower than the solubility of EDB in water, which is approximately 4,250 mg/L. Thus probability of having higher EDB source concentrations at the MMR site is high, however, this historical data, which may exist in the archives of MRR documents, was not available to us at the time this study was conducted. The source concentration range given above was selected as an estimate of dissolved phase EDB source concentrations at MMR, based on a reference which cites measured EDB concentrations at the MMR in the range of 1,550 µg/L [Masterson, 1996] and consistent observations of EDB groundwater concentrations made at the Coonamessett Pond and Water Supply Well area in the range of 0.02 µg/L to 3.0 µg/L, which were used to calibrate the analytical models.
Important findings of this study can be summarized as follows:
- The field studies conducted at the site have identified eight potential source locations for the EDB plume within the boundaries of the MMR site. These potential source locations include sites such as: CS-10, FS-9, CS-5, CS-4, FS-19, CS-3, CS-3 (USCG) and FS-2 source areas. Among these potential source areas, the CS-10 area, which is the furthest source location to the Coonamessett Pond area, is considered to be the most critical source location for the EDB plume according to the findings of the field studies. The analysis conducted in this study indicate that the EDB plume, which may have originated from the CS-10 source area, may not reach the Coonamessett Pond area within a travel time of 60 years. This observation is based on a retardation coefficient value of 2.4. The EDB concentrations originating from this source would have reached the Coonamessett Pond area much later than 1996 even if there was no remedial activity to intercept this plume to the south of the MMR boundary. However, the EDB plume originating from the CS-10 source area may have reached the barrier well area (well fence to the south of MMR) during 1983-84. Since the barrier well extraction system, which was placed to the south of the MMR, was not in operation in early 1980s, this remedial action plan may have missed the front end of the EDB plume by several years and this plume may still contribute to EDB contamination of the Coonamessett Pond region and regions further south, during 1998 and beyond, if other downstream remedial activities are not considered.
- Due to proximity of the FS-9 source area to FS-13, Pipeline spill area, CS-4 and FS-18 areas, similarities in operational chronology between these sites and the equal distances (approximately) between these source locations and the CWSW area, the analytical simulation results obtained for the FS-9 source area may also be used for the FS-13, Pipeline spill area and FS-18 areas. However, due to hydrogeologic conditions, there is the possibility of the migration of contaminants originating from FS-13 and Pipeline spill area towards the Ashumet Pond. That is why these source areas are not included in the analysis presented in this study as potential sources for the EDB plume at the Coonamessett Pond Region.
- The EDB plumes originating from potential source areas FS-18, CS-5, FS-19, CS-3 (USCG) are migrating in a southwestern direction so they may not have contributed to EDB contamination observed to the south of Coonamessett Pond.
- In this study, remaining potential source areas such as CS-4, FS-9, CS-3 and FS-2 are considered to be potential contributors to Coonamessett Pond EDB plume. FS-9 and CS-4 areas are close to each other, thus results obtained for FS-9 source area may also be used for CS-4 source area.
- Coonamessett Pond and also Deep Pond act as a hydraulic barrier and also as a sink to EDB plumes that may be originating from potential source areas such as CS-4, FS-9 and FS-2. Thus, groundwater pathway, followed by pond pathway, followed by river pathway is a more likely scenario for the EDB plumes originating from these sources;
- Numerical results indicate that this may not be the case for the EDB plume originating from CS-3 source area. Primarily due to hydrogeologic conditions and the location of the CS-3 source area relative to Coonamessett Pond, the migration pathway of the EDB plume originating from CS-3 source area is in a southeastern direction. Thus, this plume may reach the cranberry bogs area, to the east of Coonamessett Pond, without significant interference from the Coonamessett Pond. In this case the groundwater pathway should be considered to be the primary pathway for this plume.
- The early arrival time of the EDB groundwater plume, originating from the CS-3 source area, to the southeast region of the Coonamessett Pond may date back to 1962 (Table 5.1). For this arrival time, the expected concentration levels can be estimated to be in the range of 0.084 µg/L to 0.134 µg/L.
- Interaction between saturated groundwater pathways and the Coonamessett Pond has been established through field and numerical modeling studies at the MMR. Thus, accumulation of EDB in Coonamessett Pond waters is possible. Analytical modeling conducted in this study indicate that asymptotic EDB concentration levels may be reached in the Coonamessett Pond at the level of 0.032 µg/L (for a groundwater seepage concentration of 0.084 µg/L). It is estimated that this level may have been reached during early 1960s (Table 5.2), if FS-2 potential source area is considered to be a critical source for this pathway. Contribution of other source areas, more distant to the Coonamessett Pond can be found in Table 5.1 and Table 5.3. As can be seen in these tables, the EDB accumulation level in the pond water is considered constant but the time when this asymptotic level is reached changes, which is based on the arrival time of the EDB plume to the Coonamessett Pond from these source areas. The pond concentration level may increase over time, for higher groundwater concentration levels seeping into the pond, which may be observed during later years. In the analysis presented in this study this increase is not considered since we are interested in establishing early arrival times and concentration levels. However, the expected concentration increases in these pathways can be calculated using the charts and tables provided in this report.
- Accumulation of EDB contamination in Coonamessett Pond sediments is also considered. It is estimated that EDB concentration in the Coonamessett Pond sediments may reach an asymptotic level of 1.3x10⁻⁵ µg/cm3 during early 1960s (Table 5.2), if the FS-2 source area is considered as a potential source location. The pond sediment concentration level may increase, for higher pond concentration levels, which may be observed during later years. Contribution of other source areas, more distant to the Coonamessett Pond can be found in Table 5.1 and Table 5.3. As can be seen in these tables, the EDB accumulation level in the pond sediments is constant but the time when this level is reached changes, which is based on the arrival time of the EDB plume to the Coonamessett Pond from these source areas.
- Saturated groundwater seepage into the Coonamessett River has been established through field studies at the MMR. Thus, accumulation of EDB in Coonamessett River water is possible. Analytical studies conducted for this pathway indicate that dilution and advection of EDB plume in Coonamessett River waters to the south is almost instantaneous, relative to the time periods considered for other pathways. Thus it is estimated that Coonamessett River EDB concentrations, being in contact with saturated groundwater concentrations at levels of 0.084 µg/L, may reach a level of 0.048 µg/L during early 1950s (Table 5.2), when groundwater pathway is considered. The transport of this EDB concentration further south is instantaneous without significant degradation (Table 5.2). Contribution of other source areas, more distant to the north region of Coonamessett River can be found in Table 5.1 and Table 5.3. As can be seen in these tables, the EDB accumulation level in the Coonamessett River is constant but the time of arrival of this level changes, which is based on the arrival time of the EDB plume to the north Coonamessett River region from these source areas.
- The analysis discussed above, follows a groundwater to surface water pathway. However, numerical groundwater modeling study conducted for the site indicates that Coonamessett Pond may act as a hydraulic barrier and may inhibit the migration of the EDB plume further downstream. In this case, the possible pathway for the EDB plume to reach the Coonamessett River is through the Coonamessett Pond. The analytical modeling conducted in this study, indicate that for this pathway the earliest arrival time for the EDB plume would be around early 1960s at concentration levels 0.032 µg/L, if FS-2 source area is considered to be a primary source area. Through this pathway, higher concentrations are expected to occur in later years.
- Thus, either through direct groundwater pathway for source CS-3 or through groundwater and pond pathway for source FS-2, there is a high probability for EDB plume to reach the region to the south of Coonamessett Pond during early 1960. Expected concentration levels for this plume at that time would be in the range 0.032 µg/L to 0.134 µg/L.
- Accumulation of EDB contamination in Coonamessett River sediments is also considered. It is estimated that EDB concentration in the Coonamessett River sediments may reach a level of 2.1x10⁻⁵ µg/cm3 during early 1950s, if the FS-2 source area is considered as a potential source location and groundwater pathway is considered as the primary pathway. If pond pathway is considered as the primary pathway, the EDB concentration in the Coonamessett River sediments may reach a level of 1.3x10⁻⁵ µg/cm3 during early 1960s. As can be seen in these tables, the EDB accumulation level in the River sediments is constant but the time when this level is reached changes, which is based on the arrival time of the EDB plume to the Coonamessett River from these source areas.
- Emission of EDB to the air pathway from groundwater pathway and surface water pathway (river) is possible. Analytical studies conducted for the air pathway indicate that dispersion of possible EDB emissions to air is almost instantaneous relative to the other time periods considered for other pathways. Thus it is estimated that within a 100 m region of the Coonamessett River, the air concentrations may reach a level of 3.36x10⁻¹⁰ mg/m3 during early 1950s as a conservative estimate (Table 5.2). Contribution of other source areas, more distant to the north of Coonamessett Pond region can be found in Table 5.1 and Table 5.3 for this pathway. As can be seen in these tables, the EDB concentration level in the air pathway is constant but the time of arrival of this level changes, which is based on the arrival time of the EDB plume to the north Coonamessett River region from these source areas.
- We emphasize here that the pathway scenarios described above are defined for the dissolved phase EDB plume. The possibility of an EDB plume at higher concentrations (immiscible) is not investigated in this study. Field studies does not indicate the presence of such a plume.
- The procedures described in this report and contaminant reduction and accumulation factors given in MESL [1998]. may also be used in evaluating other source scenarios that may be relevant to the MMR site.
The report for the MESL study, which is summarized in this web page, can be requested from MESL. The aerial maps and habitat photo presented above are obtained from Camp Edwards ARNG site.
![]()